Attack Analysis
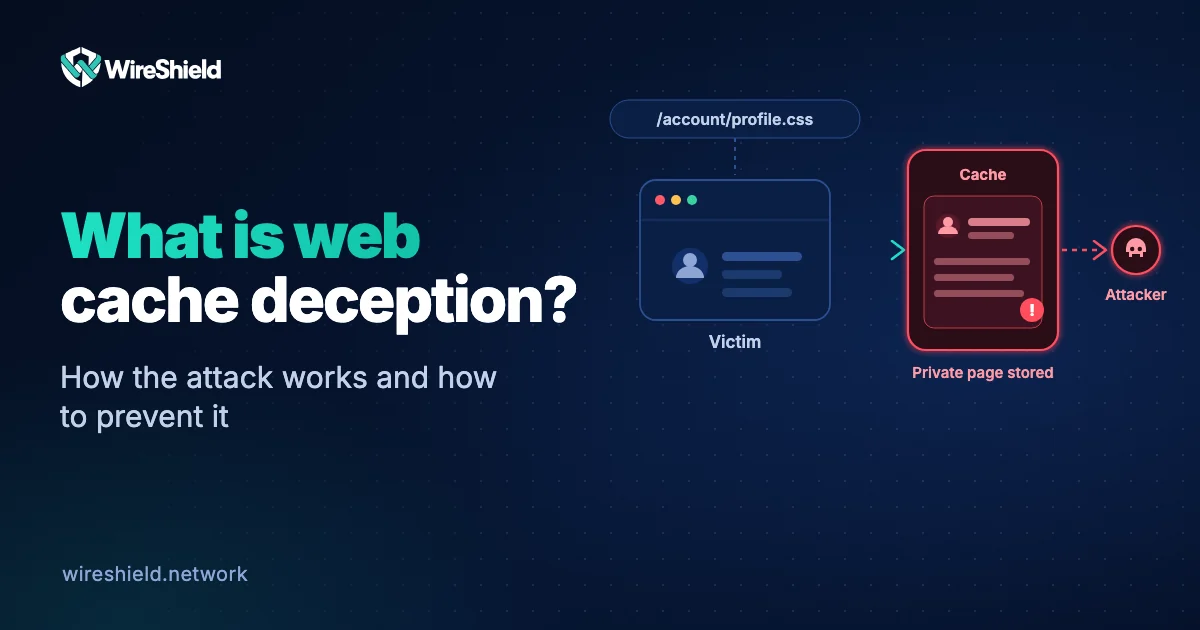
What is web cache deception? How the attack works and how to prevent it
 WireShield Team · 6 min read
Read post


Attack Analysis
What do the date, target, vector, peak and source distribution in a DDoS attack report tell you? Learn the bps vs. pps difference and how to present a report to your team.
WireShield Team
4 min read
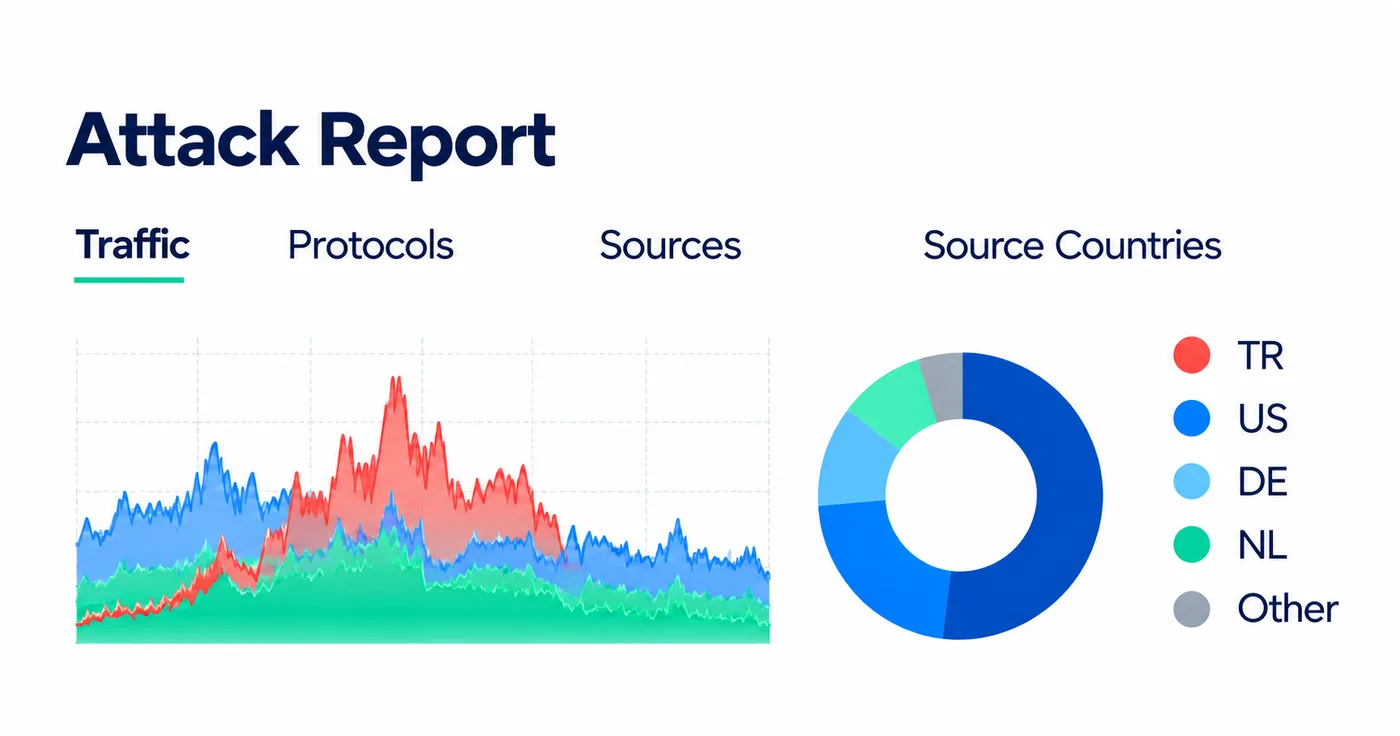
When the attack ends, the real work begins: what happened, how long did it last, where was it aimed and what did protection do? The answers are in the attack report, but a report is only useful if you read it correctly. In this post we explain the key fields in a DDoS attack report and commonly confused indicators such as bps and pps.
For every attack the portal creates a record and a downloadable report. The recent attacks table in the Customer Portal has these fields:
| Field | What it tells you |
|---|---|
| Date / time | When the attack started |
| Target IP | The address the attack was aimed at |
| Attack type and vector | For example UDP flood (UDP/123), SYN flood (TCP/SYN), DNS amplification (UDP/53) |
| Peak | The highest bps or pps during the attack |
| Duration | How long the attack lasted |
| Status | Mitigated, or still going? |
| Report | Link to download the detailed PDF report |
Read both in the peak value. bps (bits per second) shows the load on link bandwidth, while pps (packets per second) shows the packet-processing load on routers, firewalls and servers. A large-packet attack produces high bps; a small-packet attack can raise pps enormously while bps stays low, straining devices. Looking at only one is misleading. We explained which data to watch and why in the UDP flood guide.
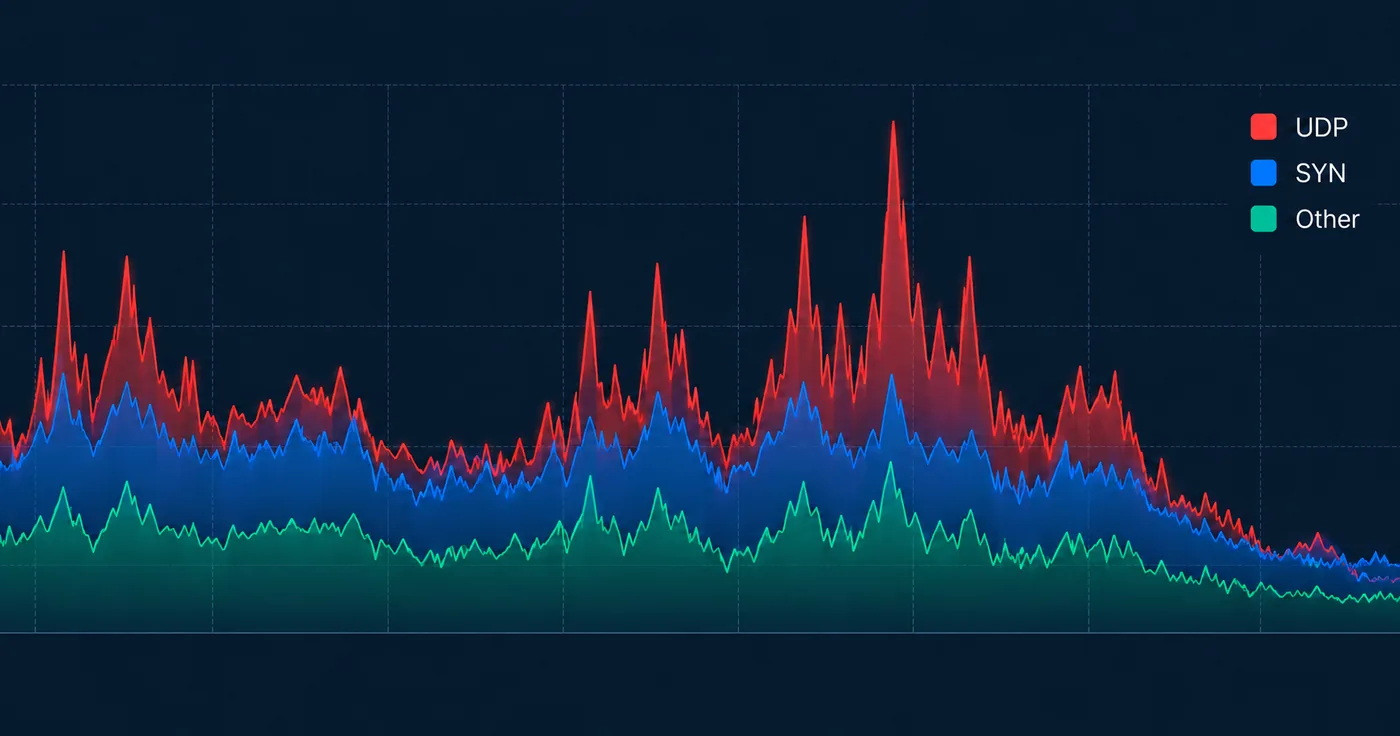
The chart has three lines: incoming, clean and dropped traffic.
The share of UDP, TCP, ICMP and other protocols explains the nature of the attack. A sudden rise in UDP share points to a UDP-based flood, SYN density within TCP to a SYN flood. Comparing the distribution before and during the attack shows deviation from your baseline.
The source distribution shows whether the attack came from specific networks or from everywhere. A narrow pool of ASNs is useful for a complaint or a filter at the source; traffic from everywhere usually means a botnet or spoofed sources. Why blocking spoofed sources one by one does not work is explained in our UDP flood post.
In the Customer Portal you find attack history, live traffic and a PDF report for every attack. The attack detail page shows live traffic, vectors, sources, targets and the mitigations applied on one screen. On the operator side, automatic attack reports, monthly summaries and SLA reports can also be scheduled. Notifications arrive by e-mail and webhook. For the portal features see the Platform page, and for detailed usage the monitoring, notifications and reports guide in the documentation. To pull data into your own systems, use the API reference.
Every row in the attack list of the Customer Portal has a report download link.
The live screen is for monitoring while the attack is going on; the report is a summary you can share and archive afterwards.
No. Especially with spoofed and botnet-based attacks, the source distribution only shows the networks the traffic came from.
To talk about how to fit reports into your own operations, talk to the technical team, or see how protection works on the remote DDoS protection page.
Attack Analysis
WireShield Team · 6 min read
Read post
Attack Analysis
WireShield Team · 6 min read
Read post
Contact our team to talk through your technical needs.