


Monitoring, notifications, reports and API
10.1 Appliance monitoring (Appliance Admin)
| Page | Contents |
|---|---|
| Monitoring → Overview (Device Overview) | Device front panel (ports, link lights, BYPASS state), device status, hostname, model, platform, serial number, device ID, firmware version, uptime; CPU (average of all cores and the busiest core), RAM, temperature, fans, power usage; Performance Trend (CPU/RAM, last hour); Hardware Health; License & Support; Interfaces (live RX/TX); Update Status. The refresh interval can be chosen (5 s, 15 s, 1 min). |
| Monitoring → Hardware | Processor (per physical CPU average usage, cores/threads, temperature; expand for cores), memory and storage, sensors (fans, power supplies, power usage, board temperatures from the BMC/IPMI), device identity (vendor, product, serial number, BIOS). A virtual machine shows that no sensors are available. |
| Monitoring → Ports & Wire Pairs | Interfaces, link state, XDP mode and counters (5 s); link speed, FEC and RX/TX ring settings, queue count (Chapter 3.5). |
| System → System | Host, WireShield daemon (version, start time, data interface), sampling rate and ring loss, audit chain, TLS certificate, interfaces and Drop reasons (counters). |
| System → Diagnostics | Network tools, System reports (CPU cores, network port, connection tracking, host firewall, routes, interfaces, system log, boot; Chapter 13.6) and packet capture (10.11). |
| System → Audit Log | Hash-chained, tamper-evident record of operations (last 200): time, user, action, target, source address, result. |
The device card at the bottom left shows the hostname and Healthy / Attention.
Health warnings
An attack is not an alarm. Attacks are tracked through attack records, notifications and the bell icon; unless there is a hardware or capacity problem, the device status does not switch to Attention during an attack. Health warnings concern the appliance itself:
| Warning | Meaning / action |
|---|---|
| A CPU core has been above 90% utilization for 5 minutes | Sustained load (a capacity problem). Short spikes during an attack do not warn. See Chapter 13.6. |
| Fan / Power supply / Temperature sensor reports warning, critical or fault | The BMC's (iLO/iDRAC) own threshold state. Check the server's hardware management interface. |
IOMMU translation is on for <port>; boot with iommu=pt | The data port runs in IOMMU translation mode; packet processing costs more CPU. See Chapter 13.6. |
| No license is installed: traffic through the appliance is limited to 100 Mbps | Import the licence (Chapter 11.4). |
| Memory usage above 90 %, free disk space below 10 % | Resource problem; contact support. |
| The TLS certificate expires soon / has expired | Chapter 5. |
| Protected interface is down | Check the cable, SFP and far end (Chapter 13.6). |
| No DNS server is configured | Name resolution fails (certificates, GeoIP, feeds). Set the servers on Network Settings → Access & TLS → DNS servers (Chapter 3.8). |
| The audit log is off | Management changes are rejected; contact support. |
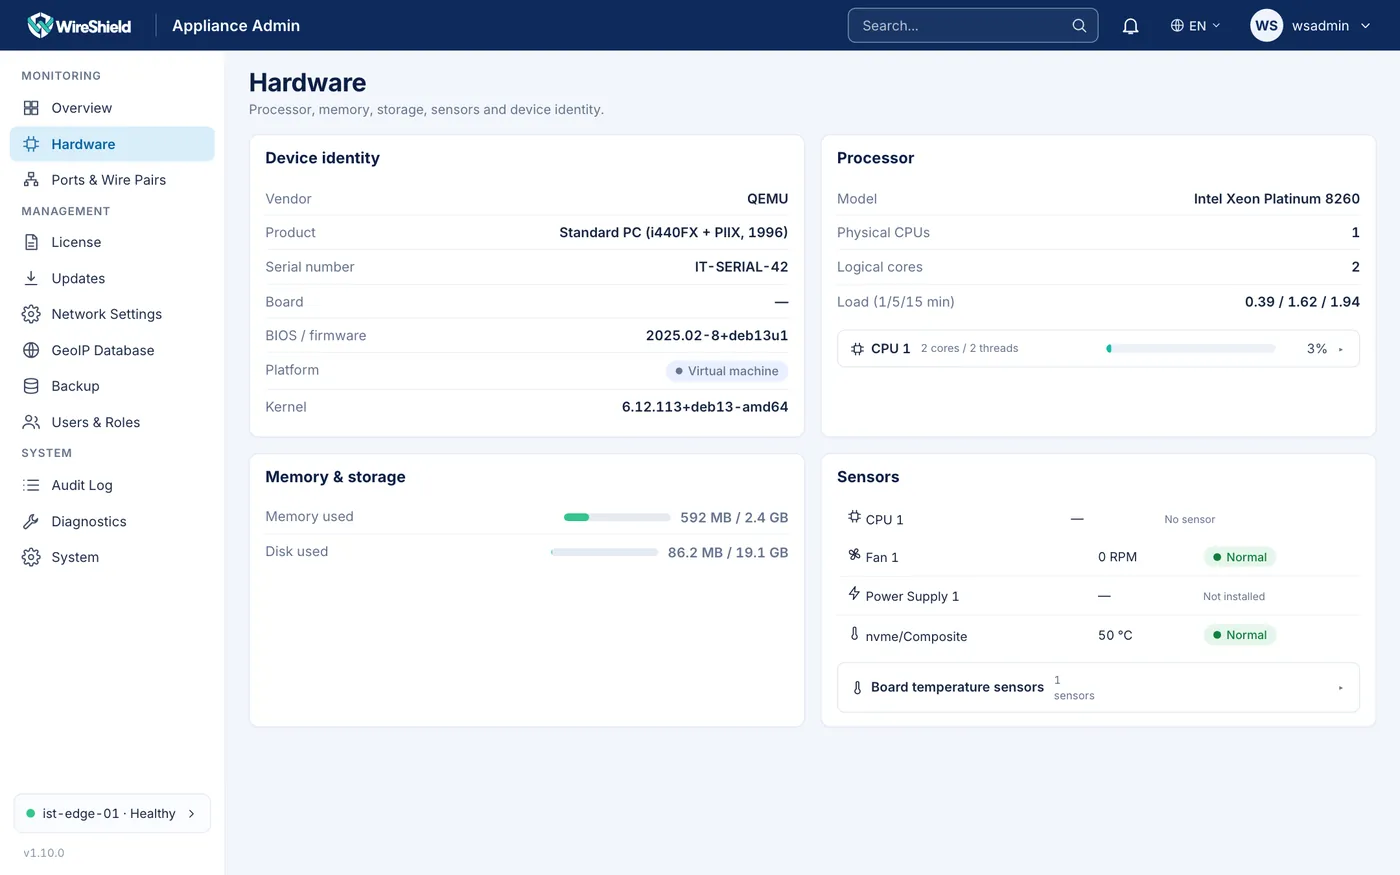
Appliance Admin → Hardware — physical CPU groups, sensors, BMC fan/PSU information 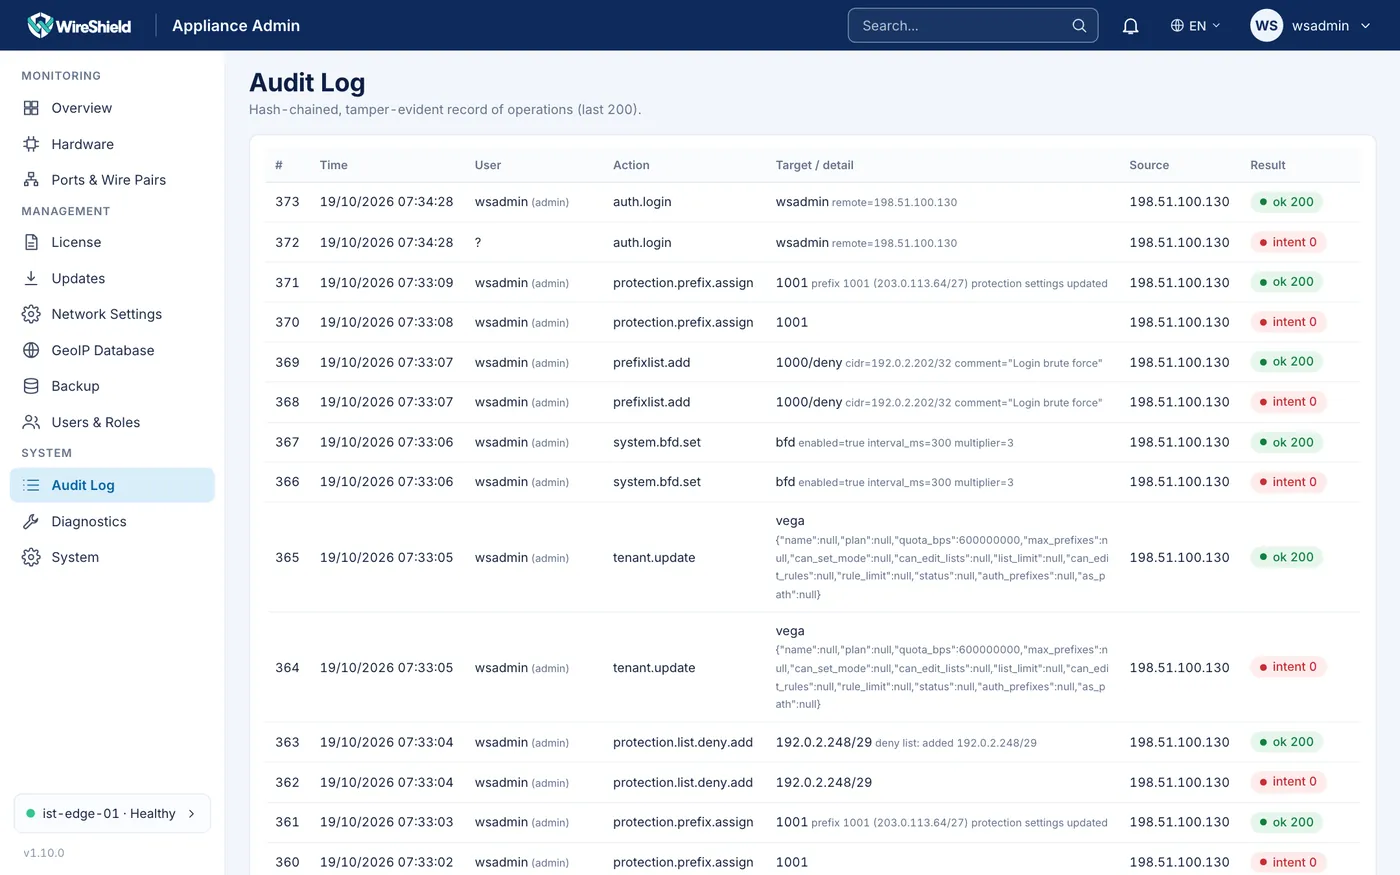
System → Audit Log — record table
10.2 Traffic and attack monitoring (MSSP and customer)
- Overview: in the MSSP view Network Protection Overview (active tenants, total prefixes, active GRE tunnels and BGP sessions, quota alerts, recent attacks, customers and quotas); in the customer view Protection Overview. Charts show a 95th percentile line.
- Attacks / My Attacks: detected attack records (newest first) with All, Active, Ended filters. Attacks with a significant share of spoofed sources are tagged "Spoofed sources".
- Protection Groups / My Prefixes: prefixes, mode, live incoming and dropped traffic; click a row for the prefix detail (traffic chart: live 1 s, last 1 h, last 6 h; most targeted hosts; sources; attacks on this prefix).
- Mitigation awaiting approval (admin/operator): while an attack on a prefix with operator approval waits for a decision, a card with Approve / Deny and a countdown appears at the top of Overview and Attacks (Chapter 7.10).
- The Search... box in the top bar searches prefixes and attacks. The bell icon shows the number of active attacks. Attack start/end, mode changes and system alerts appear as pop-up notifications.
- On every time chart you can drag with the mouse to zoom.
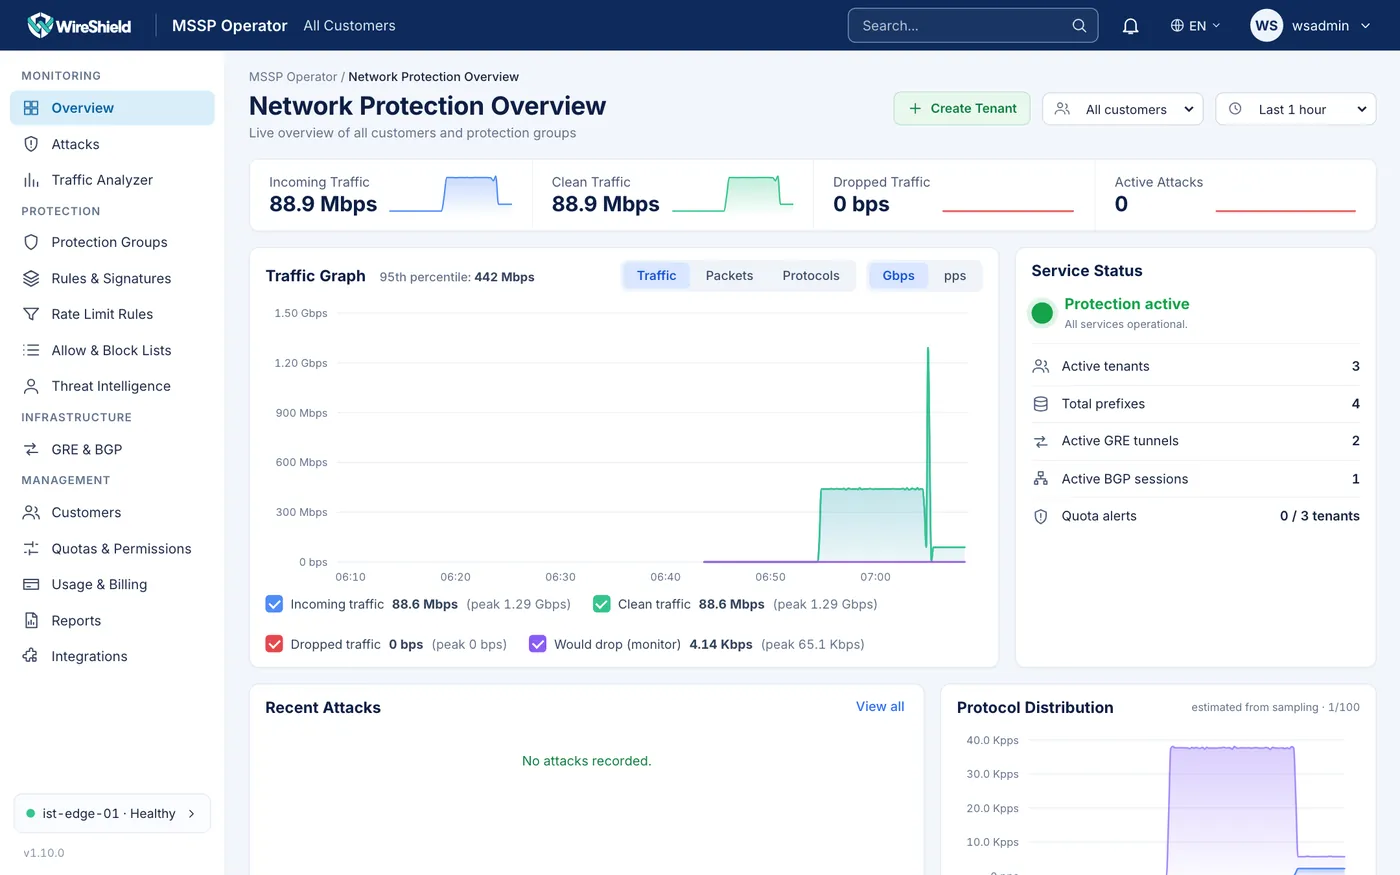
MSSP → Overview (Network Protection Overview) — KPI cards, traffic chart, recent attacks 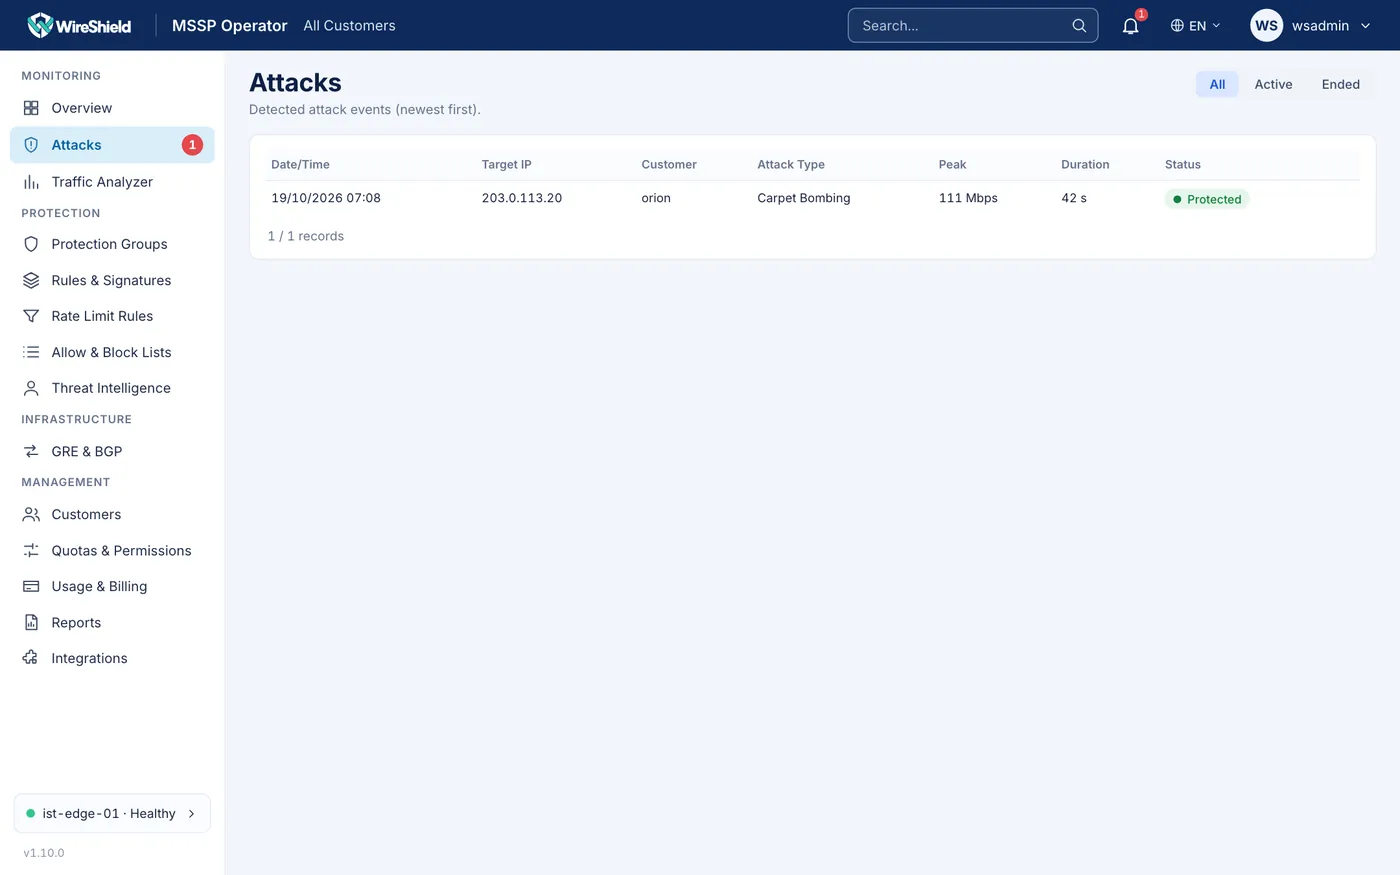
MSSP → Attacks — attack list with Active/Ended filters
10.3 Attack detail
Clicking an attack row opens:
- The header with the main target IP and vector; prefix, start, duration.
- Peak traffic, start rate, Dropped packets (in learning mode "would drop"), Detection latency (detection → mitigation).
- Attack traffic chart: live while the attack runs, 10 s resolution, from 5 min before to 5 min after; incoming / dropped / would drop.
- Traffic to the target IP, Mitigations applied (drop reasons), Vector composition (traffic class), Attack sources (top) (estimated from sampling; with country flags and AS names), target IPs and ports, source country and ASN.
- Details: event ID, start action, end, vectors, ended by, Approval state. While a decision is pending, admin and operator see Approve and Deny on the Approval line (Chapter 7.10).
- Operator notes (staff only): type in Add a note… and press Add note.
Actions:
- End manually: the attack record is closed and the prefix returns to monitoring. If traffic is still under attack it will be detected again. For a false alarm (e.g. the customer's traffic grew), tick This was normal traffic: learn the current level as normal in the confirmation; otherwise the same level is reported again after 2 minutes.
- Create PDF report (for an ended attack) / PDF report (download) / Regenerate (e.g. with the current version after an update).
During an attack, header samples (60 s before to 60 s after) are kept in the attack archive; inspect them in the console shell with incident samples <id> and incident flows <id>.
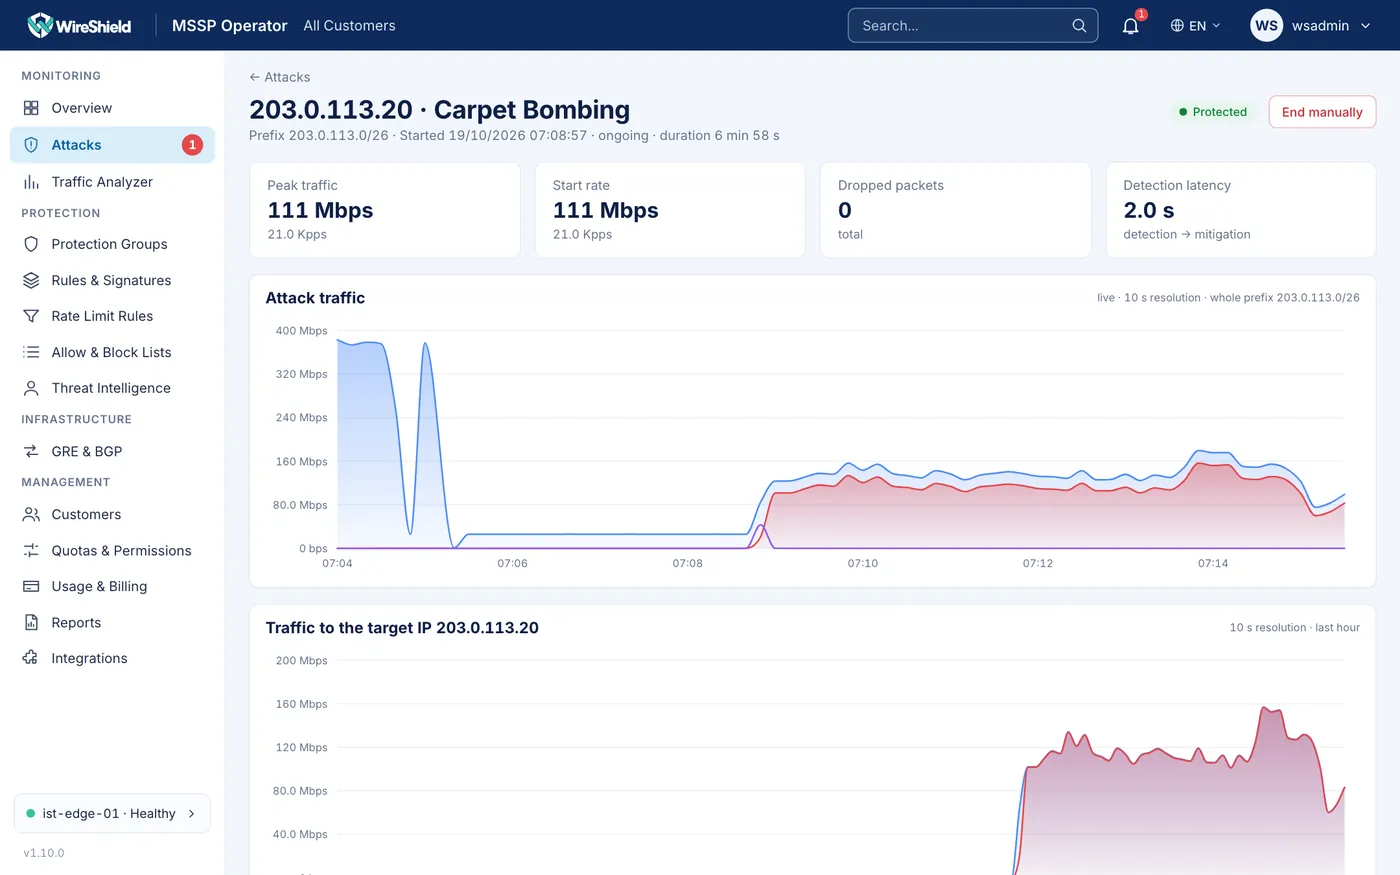
Attack detail — header, KPIs, live attack traffic chart, mitigations applied, sources 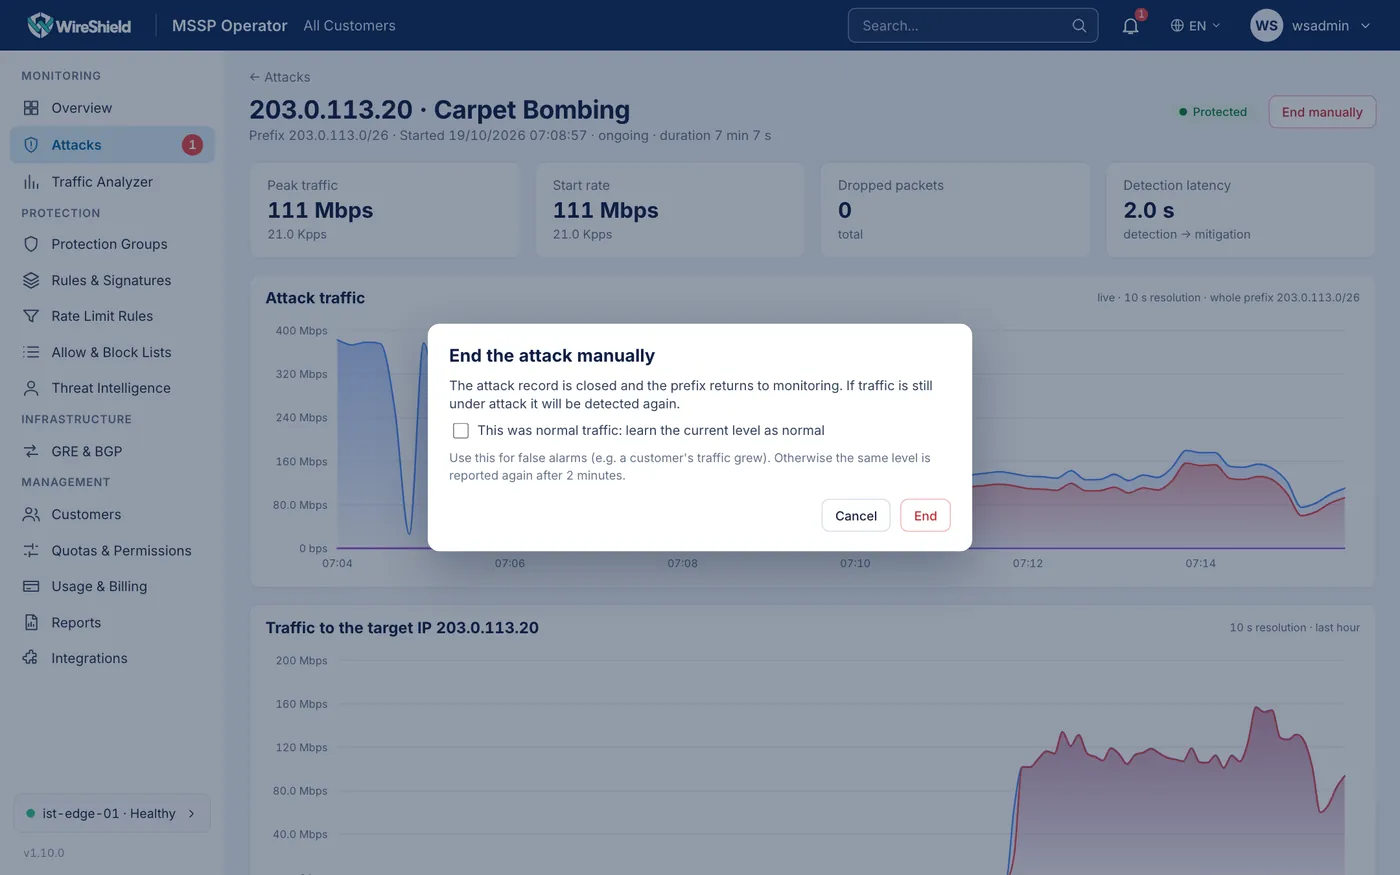
"End manually" confirmation — "This was normal traffic" option
10.4 Traffic analysis
MSSP → Monitoring → Traffic Analyzer (customer: Traffic Analysis): choose the Scope (all prefixes or one prefix). The page shows the estimated rate, estimated distinct sources, top source AS / IPs / countries / networks (/24 · /48), target ports, verdicts / drop reasons, TCP flags and packet sizes. A time chart breaks traffic down by country, ASN, protocol, port or target IP (Last 1 h, Last 24 h). Values are estimated from sampling; history is kept in memory and starts again after the service restarts.
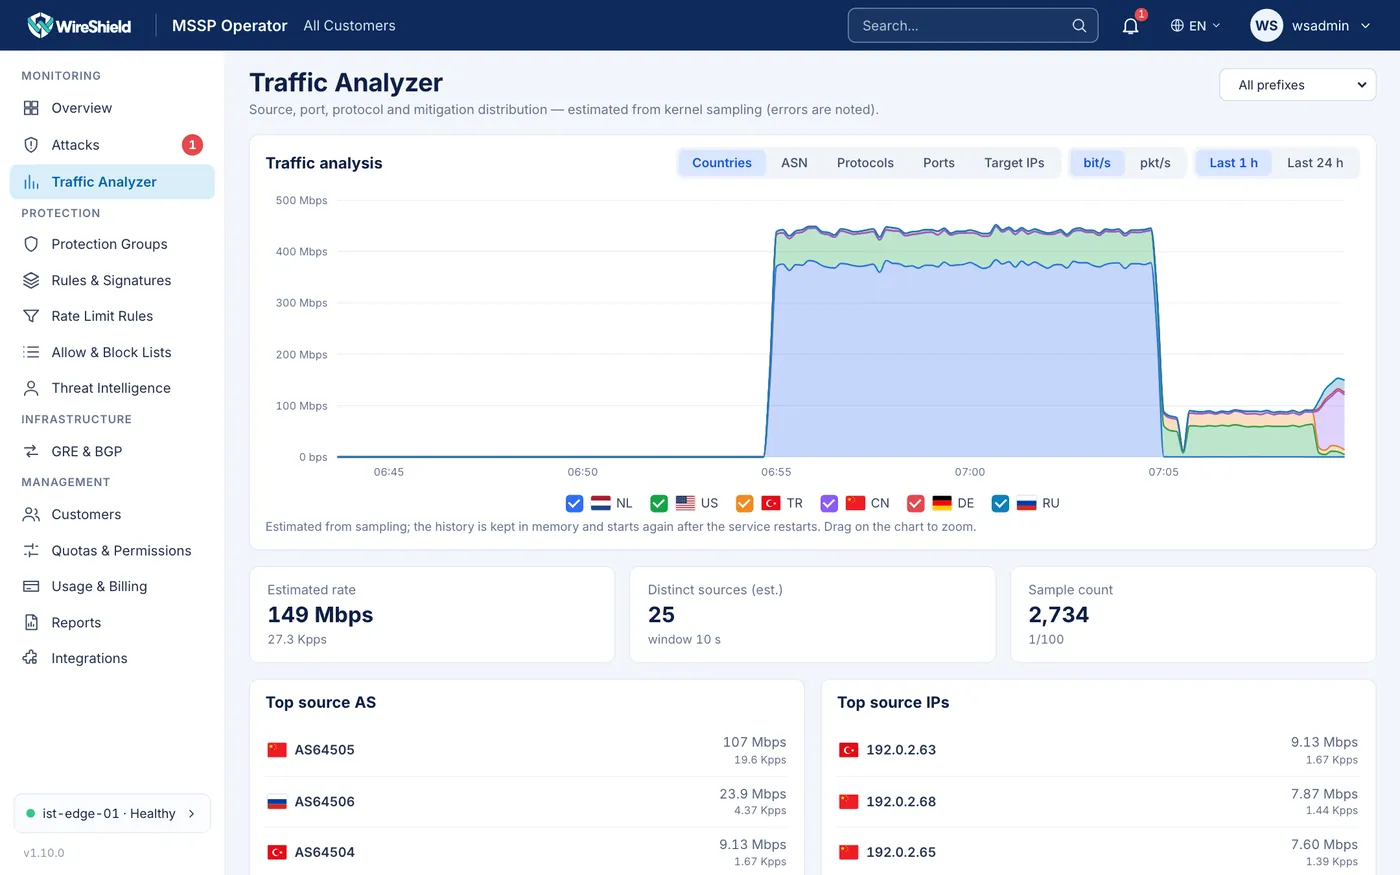
Traffic Analyzer — colour time chart by country/ASN and distribution tables
10.5 Notification channels and rules
MSSP → Management → Integrations. Admin and operator can make changes.
Adding a channel:
- Add channel → choose a type:
| Type | Fields |
|---|---|
| E-mail (SMTP) | SMTP server (host:port), Security (STARTTLS / TLS / None (unencrypted)), Username, SMTP password, From, Recipients (comma separated), Subject prefix, E-mail language, Panel address for buttons (optional), Open to customers (10.6) |
| Webhook | URL (https://…), Format (JSON / Slack), Allow plain http://, Message language, Signing secret (HMAC, optional) |
| Telegram | Bot token, Chat ID, message language |
| Syslog | Server — the transport is the address prefix: udp://192.0.2.50:514, tcp://192.0.2.50:514 or tls://192.0.2.50:6514; Format (CEF / JSON); Facility (e.g. local0) |
| SNMP trap | Trap receiver (host:port), Community, Enterprise OID (optional) |
With Customer (optional) set, the channel receives only that customer's (non-staff) events. Passwords and secrets are never shown after saving ("saved — leave empty to keep").
- Save, then test the channel with Send test.
Adding a rule: channels receive nothing until a rule sends events to them.
- Add rule → Name (e.g. "Attacks to NOC"), Events (none selected = all events), channels, Minimum severity, Only this customer (optional), Cooldown (s).
- Save.
Quick start: Send attacks and reports to all channels creates a ready rule.
Events and severities:
| Event | Severity |
|---|---|
Attack started (attack.start) | high |
Attack ended, with summary (attack.end) | info |
Mitigation awaiting approval (mitigation.pending) | high |
Mitigation decision (mitigation.decided) | notice |
Prefix mode changed (prefix.mode) | notice |
Protection settings changed (protection.changed) | notice |
Operator note added (incident.note) | — |
Report ready (report.ready; PDF attached for e-mail) | info |
System alert (system.alert) | warning / critical |
Note:
attack.endhas severity info, so a rule with Minimum severity = notice does not receive attack-end notifications; write a separate rule for them.
Delivery: failed deliveries are retried after 1 s, 5 s, 30 s, 2 min, 10 min. At most 60 messages per minute per channel; the excess is suppressed and mentioned in the next message. Delivery history (last 30) shows time, channel, event, title, result, attempt and error. For SMS, connect an SMS gateway through a webhook.
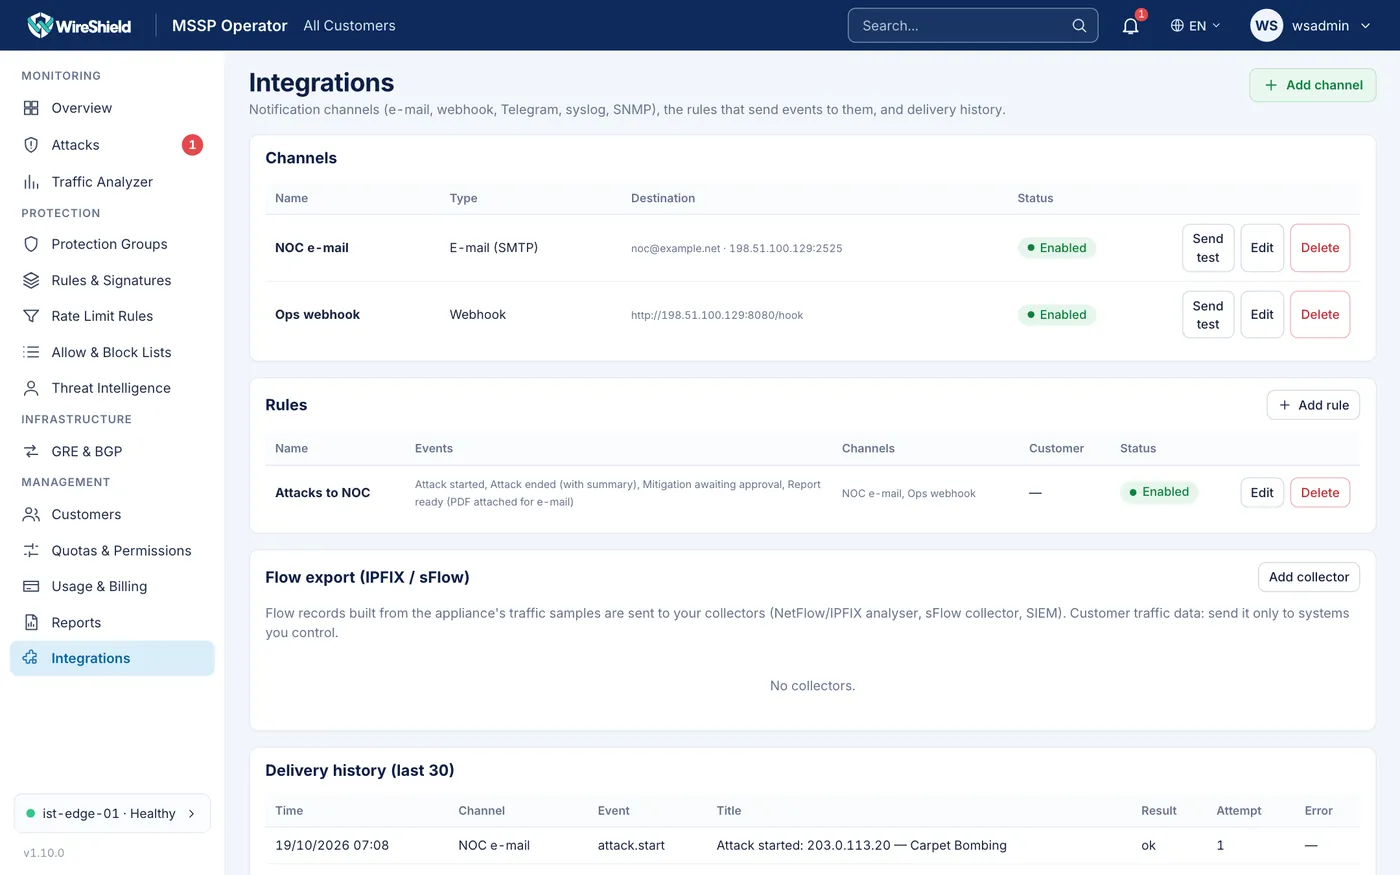
MSSP → Integrations — channels table, rules, delivery history 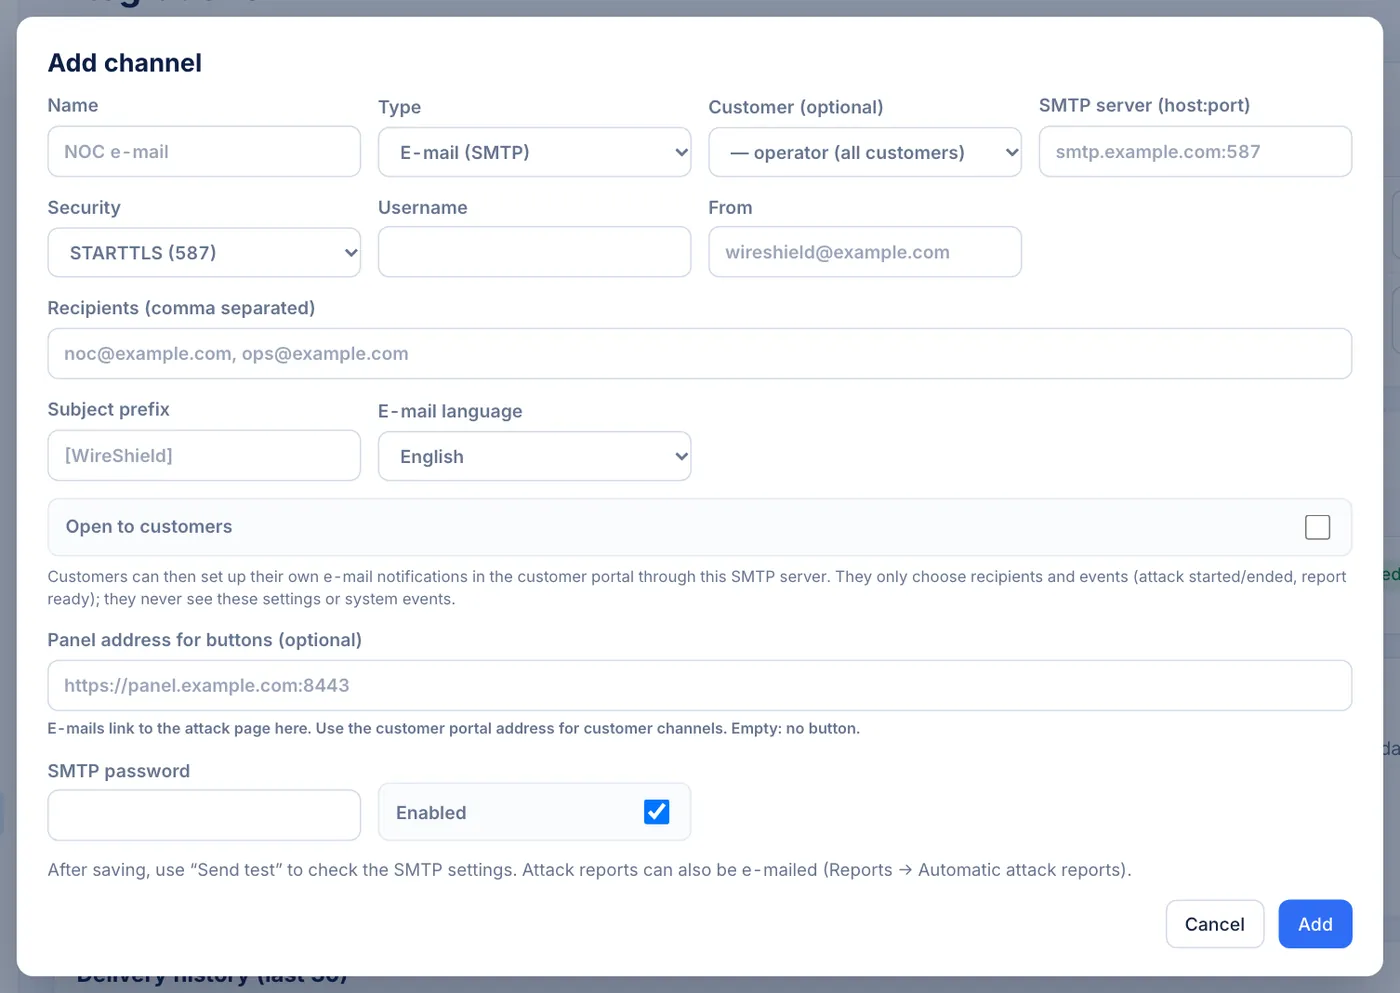
Add channel dialog — E-mail (SMTP) fields
10.6 Customer self-service notifications
E-mail (MSSP side): to open an SMTP channel to customers, tick Open to customers in the channel form and enter the portal address (e.g. https://portal.example.com) under Customer portal address for buttons in customer e-mails. Customers never see the SMTP settings.
Customer side: in the customer portal, Reporting → Notifications:
- E-mail notifications card: Recipients (one per line, at most 10), E-mail language, Events (Attack started, Attack ended, Report ready, Protection mode changed), Send e-mails switch, Save, Send test e-mail (once per minute). System events are never sent to customers.
- Webhook card: Address (https://, public internet), Format (JSON (signed) or Slack incoming webhook), Message language, events → Create webhook. The Signing secret is generated by the system and shown only once; if lost, use Rotate signing secret. The address must resolve to the public internet (private/reserved addresses are refused); redirects are not followed.
- Channels set up by your provider and Recent deliveries are listed.
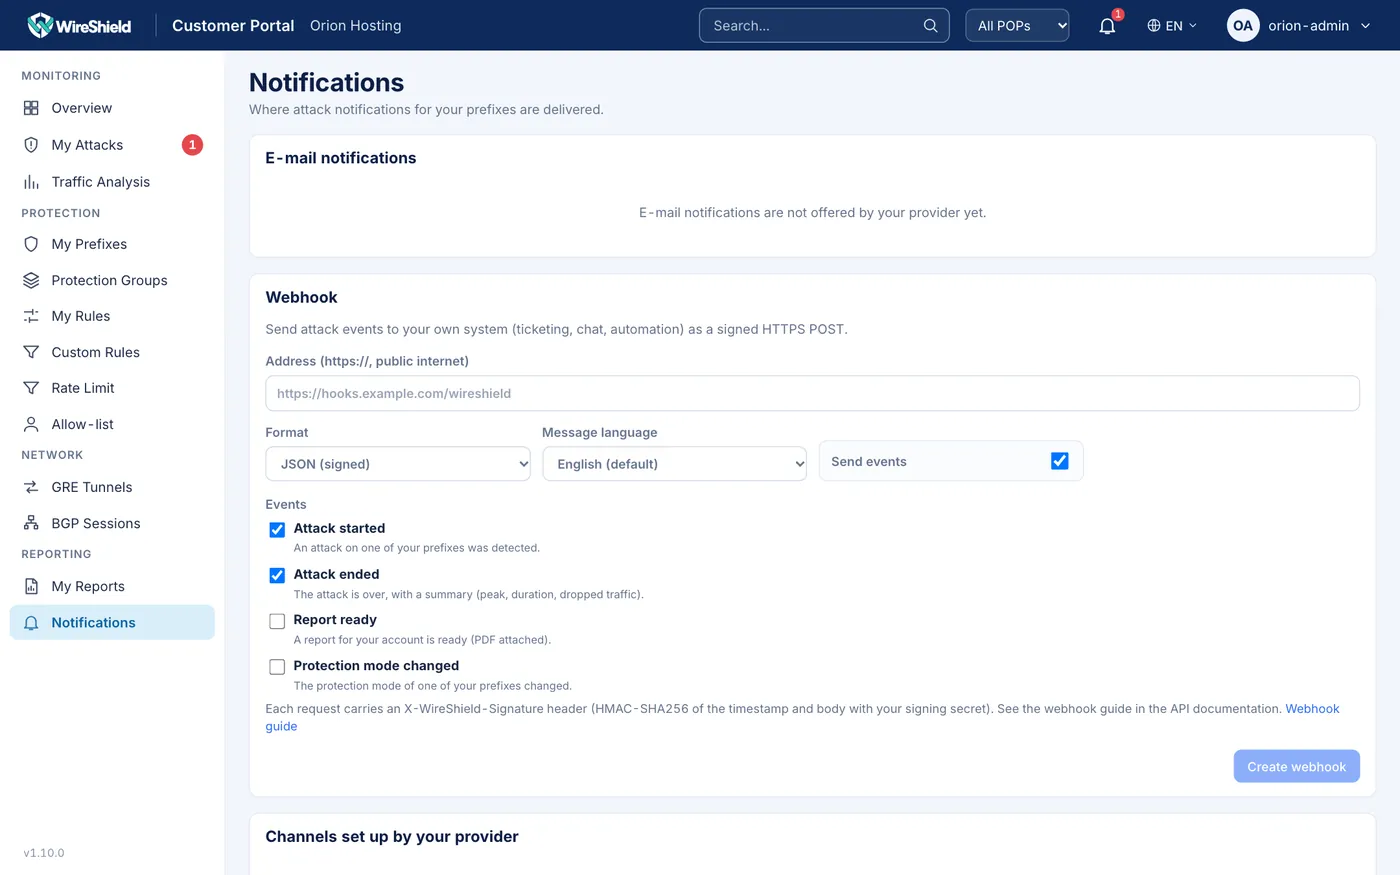
Customer Portal → Notifications — E-mail notifications and Webhook cards
10.7 Syslog / CEF
A syslog channel sends RFC 5424 messages over UDP, TCP or TLS. The body is ArcSight CEF (default) or the webhook JSON. Example header:
CEF:0|WireShield|DDoS Appliance|<version>|attack_start|<title>|8|...| Field | Contents |
|---|---|
| Signature ID | Event type (attack_start, attack_end, prefix_mode, system_alert, …) |
| Severity | 1 info, 3 notice, 5 warning, 8 high, 10 critical |
rt, externalId, msg | Event time (ms), event id, title |
cs1–cs5 | vector, prefix, tenant, action, user who made the change |
cn1–cn3 | peak pps, peak bps, duration (s) (attack end) |
Facility defaults to local0, app name to wireshield. A private CA can be set for TLS.
10.8 Verifying webhook signatures
Each request carries: Content-Type: application/json, User-Agent: WireShield/<version>, X-WireShield-Timestamp: <unix>, X-WireShield-Signature: sha256=<hex>.
Signature = hex(HMAC-SHA256(secret, timestamp + "." + raw_body)). On the receiver:
- Compute it over the raw request body.
- Compare with
"sha256=" + hexusing a constant-time comparison. - Reject timestamps more than 300 s from now.
Body fields: schema, id, event, severity, time, host, version, prefix_id, prefix, tenant, title, body, fields (vector, action, pps, bps, target, incident; values are strings). Any 2xx response is success. The Slack format sends {"text": "title\nbody"}.
10.9 API, event stream and Prometheus
- API documentation: the appliance serves separate references for customers and MSSP staff:
/docs/api/customer.htmland/docs/api/mssp.html(the API documentation link on the API tokens page). They include guides for tokens, errors, the event stream, webhooks, syslog and Prometheus. - Authentication:
Authorization: Bearer wsk_…(Chapter 9.8). Example:
curl -H "Authorization: Bearer $WS_TOKEN" https://panel.example.com:8443/v1/prefixes- Live event stream (SSE):
GET /v1/events. Events:attack.start,attack.end,prefix.mode,mitigation.decided(both audiences); for staff alsomitigation.pending,protection.changed,incident.note,report.ready,system.alert,bgp.session.up/down,bgp.prefix,tunnel.health,escalationand others. On reconnect,Last-Event-IDreplays the last 1000 events; a: pingarrives every 15 s. At most 5 streams per user. - Prometheus:
GET /metrics(on the management listener; not available through the portal). Use a read-only token restricted to the Prometheus server's address:
- job_name: wireshield
  scheme: https
  metrics_path: /metrics
  authorization:
    type: Bearer
    credentials_file: /etc/prometheus/wireshield.token
  static_configs:
    - targets: ['192.0.2.10:8443']
Metrics: data-plane counters and drop reasons, per-prefix rates and mode, attack state, notification delivery, telemetry, audit chain, system CPU/memory/disk, interfaces, licence state.
- System endpoints (new in 1.10.0): admin only, accepted only on the management interface (not through the portal), every change written to the audit log:
- Backups (Chapter 11.3):
GET /v1/system/backups(list, schedule, remote targets),POST /v1/system/backups(back up now),GET /v1/system/backups/download?name=<file>,POST /v1/system/backups/upload?name=<file>(upload a.wsbakfor checking or restoring),POST /v1/system/backups/verify,POST /v1/system/backups/restore,PUT /v1/system/backups/remote(SFTP/S3 settings),POST /v1/system/backups/remote/test,POST /v1/system/backups/remote/push(send the newest backup now). - DNS (Chapter 3.8):
GET/PUT /v1/system/dns. - Rate limits: 20 requests/s per user (burst 40), 60 requests/s per client address.
10.10 Reports
MSSP → Management → Reports (customer: Reporting → My Reports): generated PDF reports (attack, monthly summary, SLA) are listed and downloadable. Customers see only their own reports.
Automatic attack reports:
- On the Reports page, switch on Automatic attack reports: a PDF is created automatically after every attack ends (when the attack's traffic record is complete, about 6 minutes later).
- Optionally choose an e-mail channel under Also send by e-mail to (add an e-mail channel under Integrations first).
Report types:
| Type | Contents |
|---|---|
| Attack report | Traffic chart (incoming/clean/dropped, 10 s), duration, peak bps/pps, dropped data, vectors, response timeline, source IP/ASN/country tables, mitigations applied |
| Monthly summary | Attack count, total duration, peaks, vectors, top targets |
| Customer SLA | Attack count, average/maximum detection → mitigation time, share mitigated within target, dropped traffic, usage p95 and quota |
PDFs are in English. Operator names and notes are not included. Reports created by hand are not e-mailed through notification rules; scheduled and attack-end reports are.
Scheduled reports (admin/operator): the Scheduled reports card lists the schedules with type, customer, When, Next run and Last run; Run now creates the report immediately, Edit and Delete change or remove a schedule (reports already generated are kept).
- Press New schedule.
- Name and Type: Monthly summary or Customer SLA.
- Customer: all customers (monthly summary only) or one customer. For Customer SLA choose the customer and set SLA target: mitigation within (ms) (default 10000).
- Repeat: Monthly (with Day of month, 1–28), Weekly (with Day), Daily or Manual only; for the first three also Hour (0–23) and Time zone (e.g.
Europe/Istanbul; the panel suggests your browser's time zone). A monthly run covers the previous calendar month, a weekly run the previous 7 days, a daily run the previous day. - Send by e-mail to: tick e-mail channels (only channels of all customers, or of the chosen customer, are offered; add an e-mail channel under Integrations first).
- Keep Enabled ticked and press Create.
A monthly summary on the 1st of every month is a good start.
Generate now creates a single report without a schedule: choose Type, Customer, Month (and the SLA target for an SLA report), then Generate. Such reports are not e-mailed.
In the console shell, report list lists the reports and report schedule list the schedules.
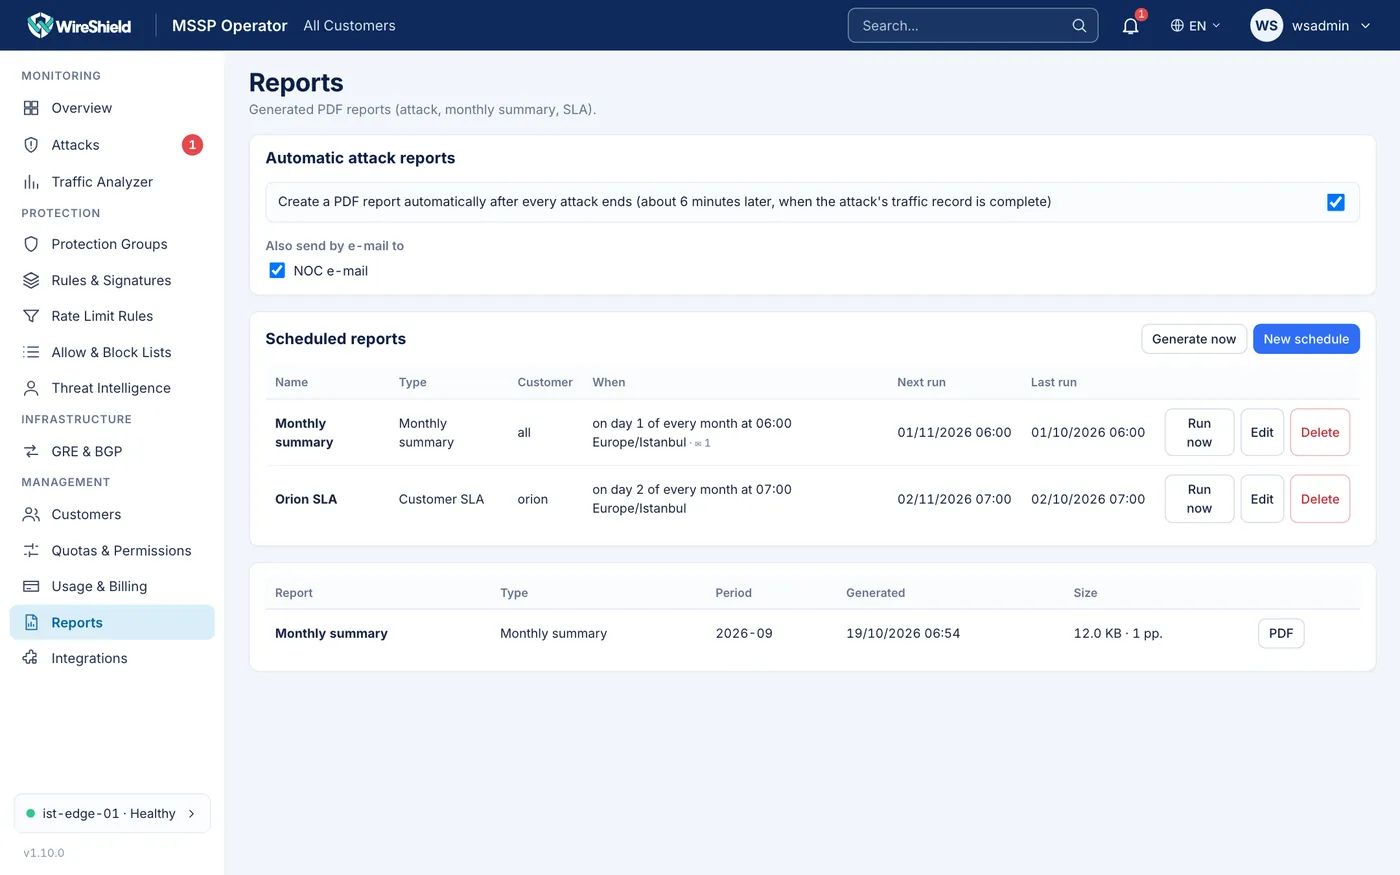
MSSP → Reports — report list, the "Automatic attack reports" switch and the "Scheduled reports" card
10.11 Packet capture (PCAP)
System → Diagnostics → New capture (admin/operator only):
- Choose Prefix, Duration (s, max 300), Protocol, Source IP/CIDR, Destination port.
- Start capture.
- The Captures table shows state, packets and size; download with PCAP, or Stop / Delete.
Captures contain payload (up to 256 bytes per packet); every download is audited. One capture per prefix, 8 at a time.
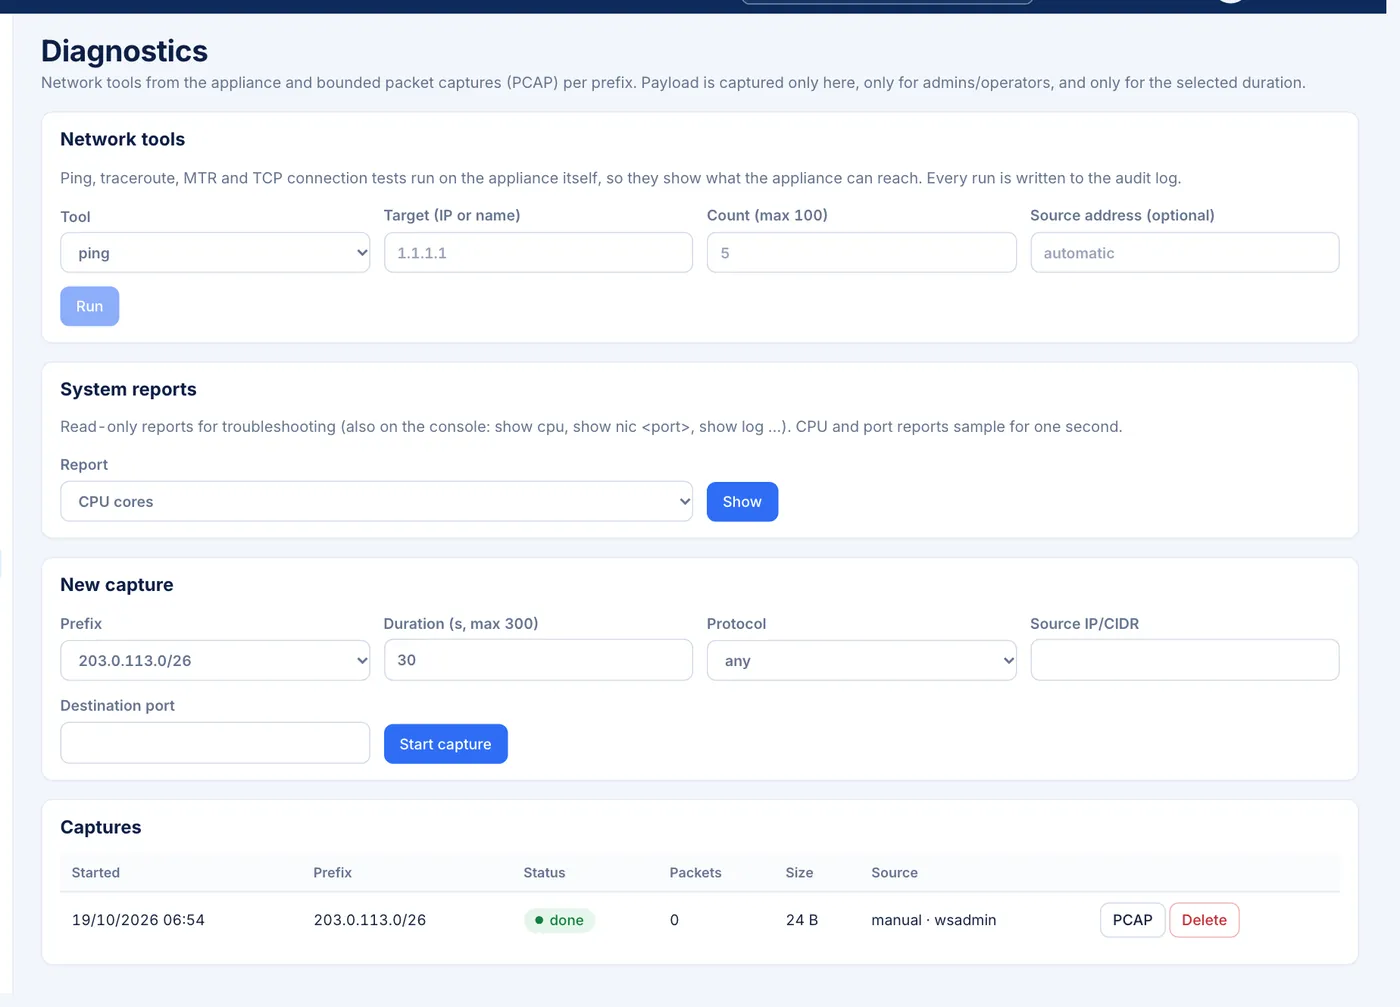
Diagnostics → New capture form and Captures table
10.12 IPFIX / sFlow export
Flow records built from the appliance's traffic samples can be sent to external collectors (NetFlow/IPFIX analyser, sFlow collector, SIEM). Admins set them up in MSSP → Integrations → Flow export (IPFIX / sFlow):
- Click Add collector.
- Enter a Name (lowercase letters, digits,
-,_), the Type (IPFIX or sFlow v5) and the Collector address (host:port), e.g.192.0.2.50:4739for IPFIX or192.0.2.51:6343for sFlow. - IPFIX: choose the Transport (UDP or TCP) and optionally the Active flow timeout (5–300 s, default 30). sFlow: optionally the Agent address (this appliance as the collector sees it).
- Optionally limit what is sent: Only these prefix IDs and the Send check boxes (passed, dropped, would drop (monitor), challenged (SYN validation)); none ticked = all traffic.
- Save. The change applies immediately; unchanged collectors keep running.
The table shows records and bytes sent, the last send time and errors per collector. Exported flows are customer traffic data: send them only to systems you control. In the console shell, export show lists the collectors.